
TLDR:
- Most of the UK’s energy comes from Natural gas, of which ~50% is imported. When the North Sea production peaked in 2000, we didn’t act quickly enough to plug the gap.
- A large factor of why costs are higher than most of Europe is because of low domestic production and storage, increasing exposure to spot market imports.
- The trickle down impact of high energy costs obliterated manufacturing competitiveness, with the same energy today having 75% less manufacturing output purchasing-power as it did back in 2000.
- We can get back on-track with huge battery and physical storage deployment, some key transmission build-outs, and support for wind and synthetic fuels.
Where are we today?
The UK had an average electricity price of 27.03p/kWh from the 1st April (capped by Ofgem), which when normalised for EUR:GBP at 0.85, is roughly 2-3x that of some European countries like Sweden (15.3p/kWh), Norway (10.2p/kWh), and Iceland (7p/kWh). Why?
Energy markets follow supply and demand. If we don’t produce any energy and supply is low, demand causes prices to rise. Secondly, energy demand is very inelastic. Price elasticity is defined by the percentage change in quantity consumed divided by the percentage change in price. Energy demand in the short-term is very inelastic (e.g demand doesn’t change much with increasing costs), as people still need to heat their homes, cook, or travel to work. Practically, this means consumers “suck it up” in the near-term because they don’t have much choice. This inelastic relationship is why we see large price spikes, as the new equilibrium (e.g the point at which demand drops because the price is too high) requires a much higher price to reduce demand in the long-term:

A perfect example in 2022 when supply dropped, prices rose, and demand remained inelastic until such an extreme price that something had to give. Until it reaches that new equilibrium point, prices stay high in a local maxima, until the price-point becomes prohibitively expensive for even the daily essentials, which drops demand and pulls price with it.
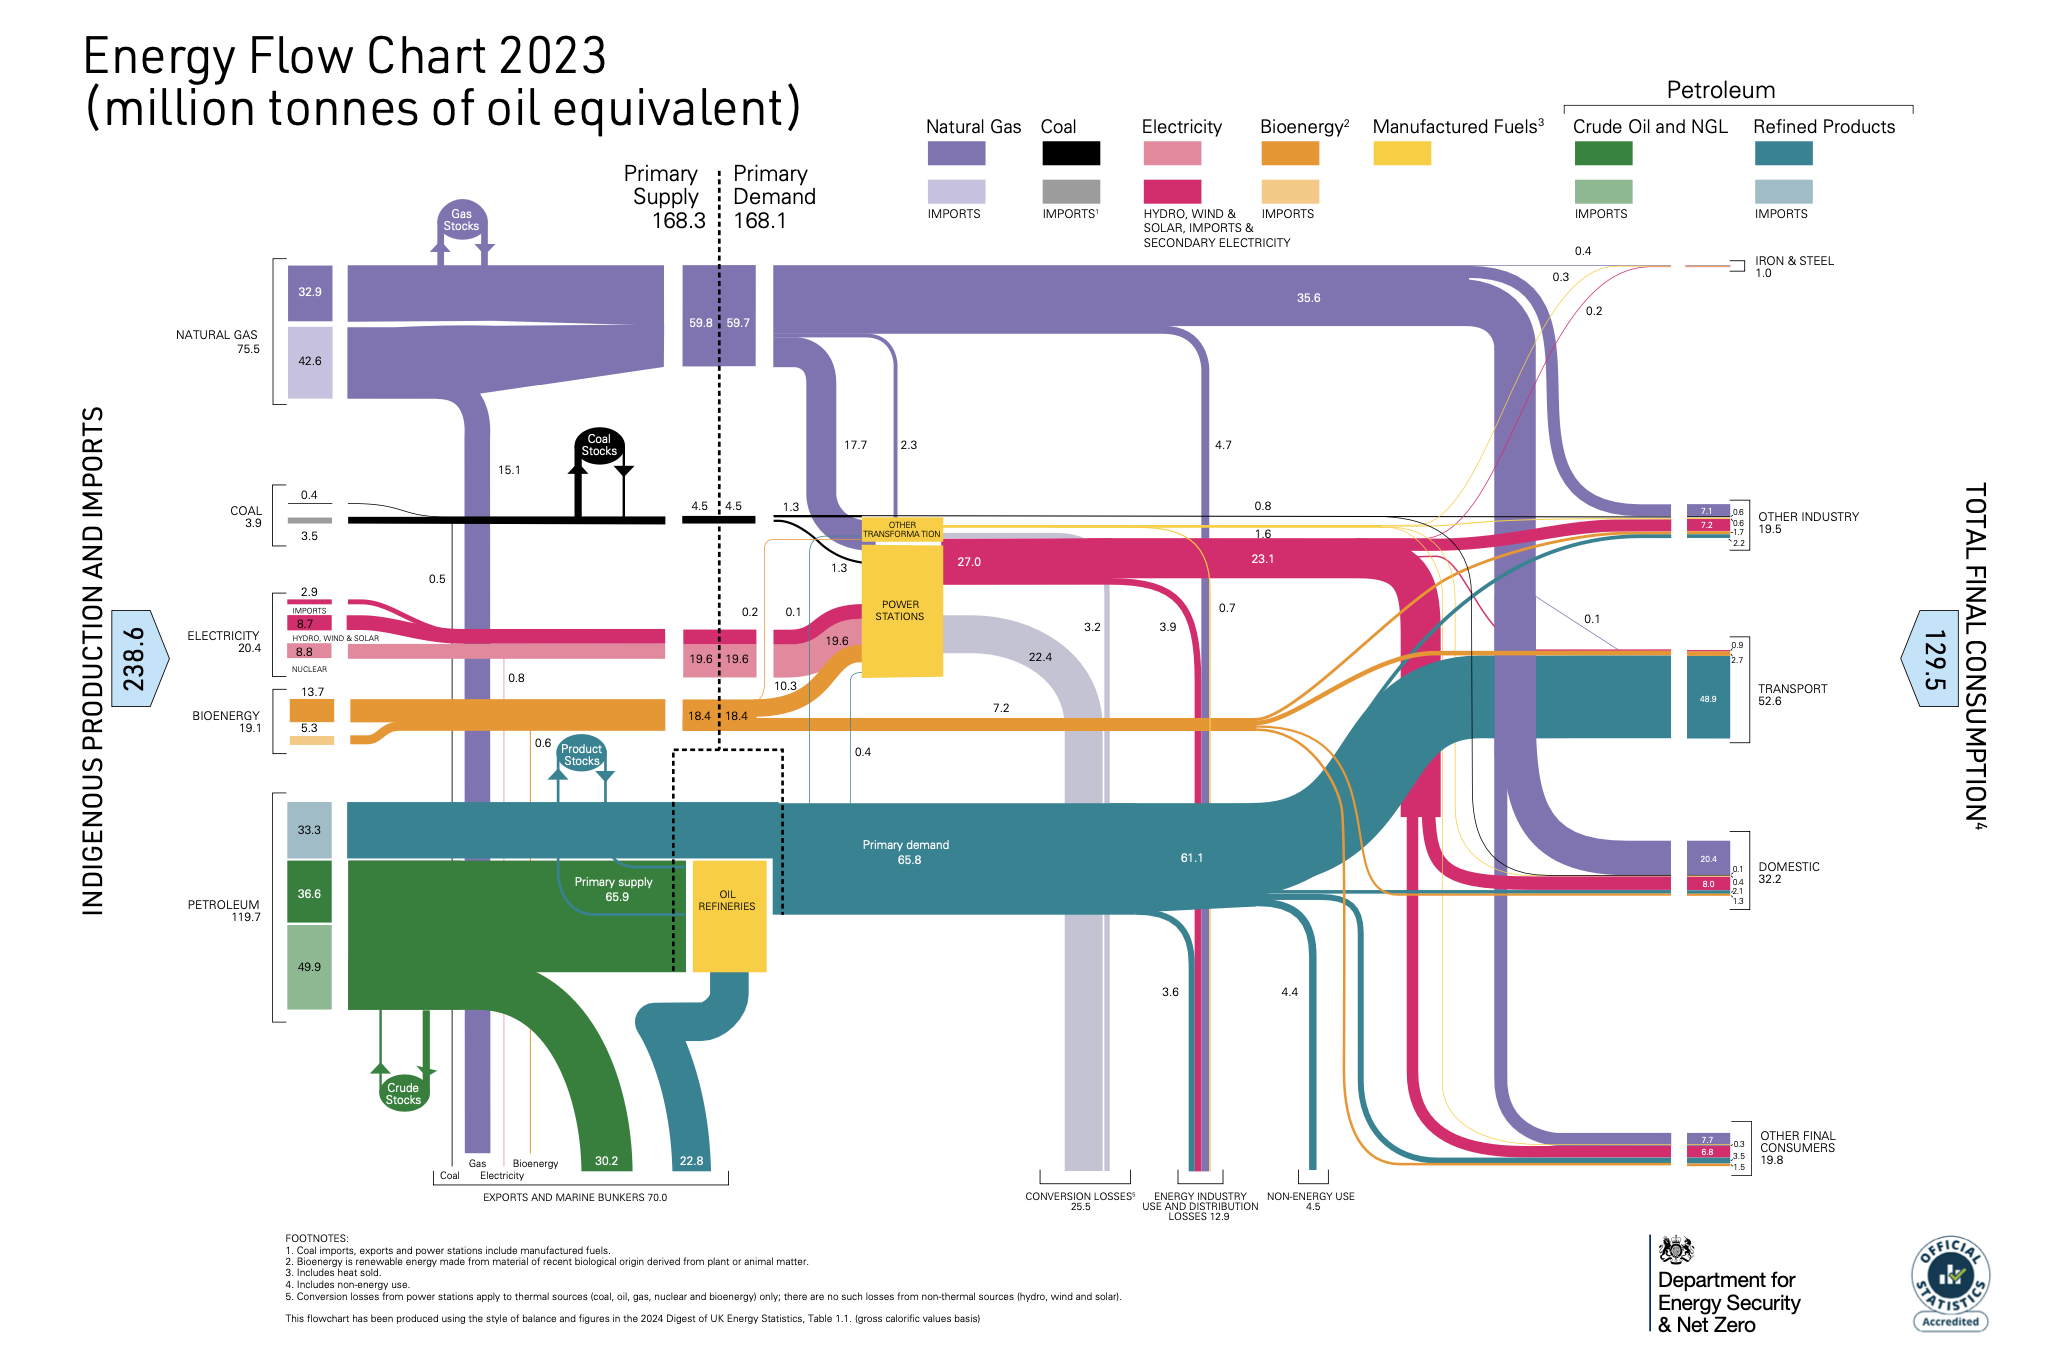
The UK consumed 1710 terawatt-hours (TWh) of energy in 2023, across the following areas:
- Transport: ~38%
- Domestic (Households): ~29%.
- Industry: ~17%.
- Services:~13%.
- Agriculture and Other Sectors: (the remainder, ~3%)
Where did that energy come from?
- Natural Gas: 705 TWh
- Oil: 603 TWh
- Coal: 51 TWh
- Nuclear: 124 TWh
- Renewables: 261 TWh
Now, where did that energy come from?
| Energy source | Import share | Main import countries | Source |
|---|---|---|---|
| Natural gas | ≈ 42 % | Norway (~41 %), United States (LNG), Qatar (LNG) | DUKES 2024 |
| Oil | ≈ 43.6 % | Crude oil – Norway; Refined products – Netherlands | UK crude‑oil import origins |
| Coal | ≈ 2.7 % | Various international suppliers | DUKES 2023 |
| Bio‑energy | ≈ 1.6 % | Various (wood‑pellet / biomass suppliers) | USDA FAS Wood Pellets Annual 2024 |
| Electricity | ≈ 1.4 % | France, Netherlands, Belgium (via interconnectors) | Porter (2024) Interconnector report |
Import‑share figures are expressed as the percentage of the UK’s total primary energy imports (latest available year, 2023/24).
Electricity is the most ubiquitous in that energy mix, so we’ll use that to form the baseline. How do we produce electricity in the UK today?
- Natural Gas: 34%
- Wind: 29.4%
- Nuclear: 14.2%
- Solar: 4.7%
- Hydroelectric: 1.9%
- Biomass and Waste: 11.7%
- Coal: 1%
- Electricity Imports: 10.7%
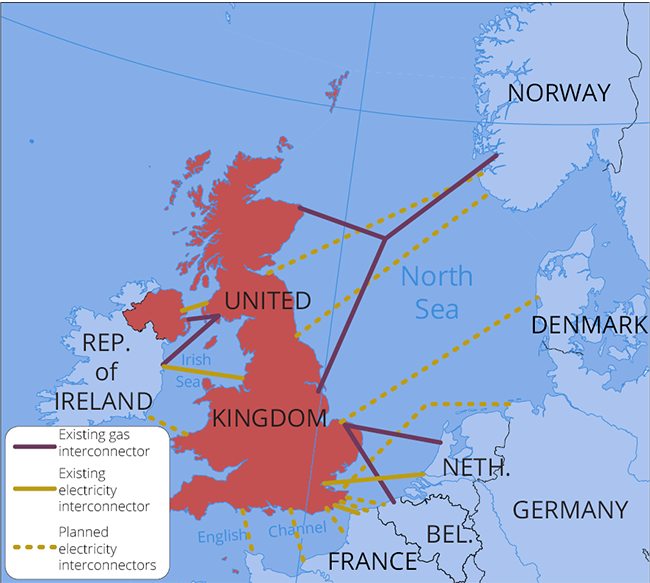
Natural Gas accounts for ~34% of the UK’s electricity generation, with only ~56% being produced domestically in the North Sea (and a little in Wytch Farm), with the balance being made up from various interconnector pipelines (below image and exhaustive list here) and LNG imports across the US, Middle-east and Asia. The sources of interconnector and LNG imports have concentrated post the Ukraine conflict, as previously almost 34% of all gas in the UK came from Russia.
The pricing of this gas follows supply and demand laws, anchoring on global supply and the UK’s domestic storage. The UK has very little gas storage, made worse after closing its largest storage facility (Rough) in 2017. As of today, there is 3.1 billion m^3 (30-35 TWh) of storage, meaning we have between 12 days (average winter demand) and 7.5 days (peak winter demand) of storage. Prior to the closure of Rough, the UK had >24 days full storage capacity. This is in stark contrast to countries like Germany, Netherlands and France, that have >100 days worth of storage.
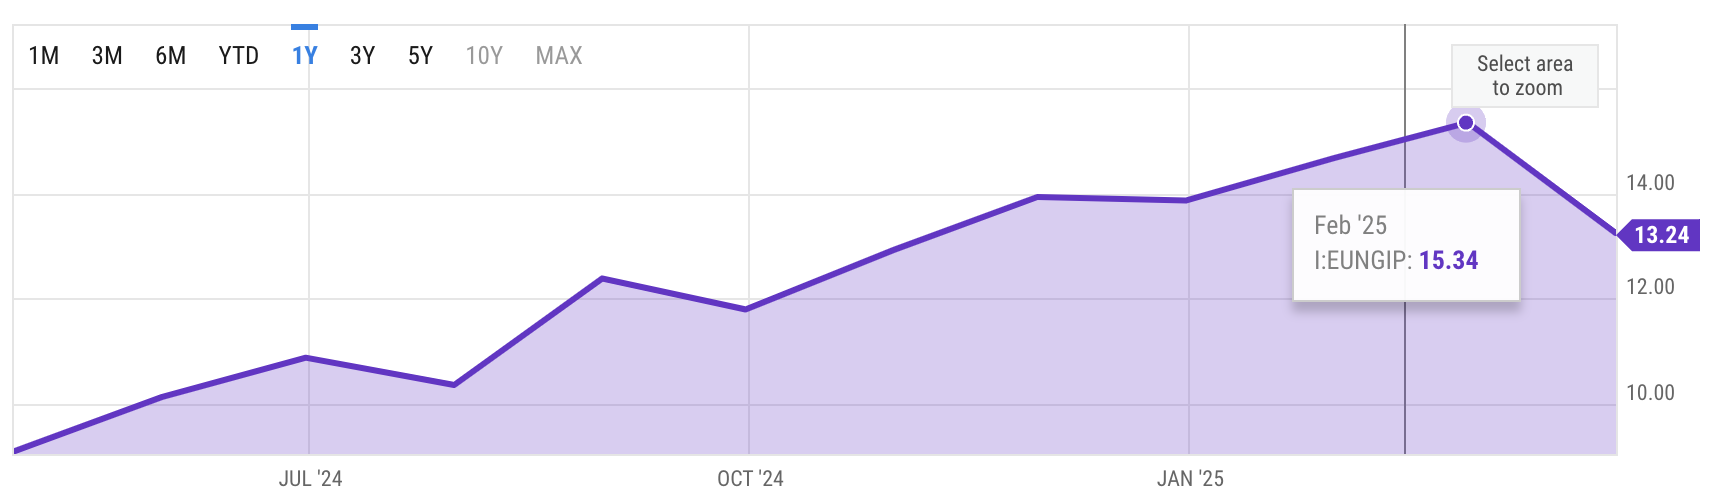
As storage dwindles and natural gas maintains a large % of overall energy, the UK becomes over-exposed to market fluctuations. Most recently in January 2025, the combination of harsh weather and low-storage reserves caused emergency purchasing of LNG from Asia, Egypt and the Middle-east. The graph below is the average price paid at the EU border for imported pipeline and LNG gas, describing an average of all gas physically entering the EU. Whilst you can’t split out the UK specifically, the trendline shows pricing climbing from $8.6USD/MMBtu (spring 2024) to >$15USD/MMBtu (spring 2025) as European demand increased relative to lower storage volumes.
Marginal pricing
Since the UK operates on a liberalised energy market (where energy is purchased and sold in a free-market rather than a state-controlled mechanism), it causes the floor pricing to reflect that of the most expensive producer required to meet consumer demand. For example, when the most expensive gas is fired in the most expensive, inefficient gas-peaking plant to meet demand, this sets the entire market price floor – irrelevant of (1) other cheaper alternative methods of energy production and (2) whether you as a consumer actually consumed that energy.
An example of this inefficiency is that when there’s oversupply of renewables during the middle of the day that should plummet pricing to near zero, it could be supported by the price-floor of a horrendously expensive producer. Good for producers, bad for consumers.
One of the negative sides of this is that when energy suppliers sign contracts with customers, they often agree fixed-price deals that don’t always reflect the volatility in the market. If wholesale prices go north, they’re going to have to pay. For example, Bulb, Avro Energy and Green Supplier limited all collapsed under the market spikes of 2021, impacting >2.5m customers until the Government stepped in.
Transmission costs
Another factor that drives pricing higher, is that the UK has some of the highest transmission fees in Europe. Specifically, these fee’s energy suppliers must pay to use the high-voltage electricity network or the high-pressure gas pipeline network to move energy around the country. Largely this is a factor of both aging infrastructure (both electrical and gas) and grid-balancing to integrate renewables into the grid.
Alongside electrical transmission, gas transmission (LNG imports via Isle of Grain, South Hook or Teeside) incur costs approx 70% higher than the average northwest European terminals. These costs are broken down into:
- Entry capacity charges – Injecting in the NTS (National Transmission System)
- Exit capacity charges – Delivering gas to customers
- Commodity charges – Volumetric fee per therm/kWh of gas transported
This disincentivises gas shippers to ship into the UK, and instead pushes them to divert cargoes away towards Belgium or Netherlands where entry fees are significantly lower.
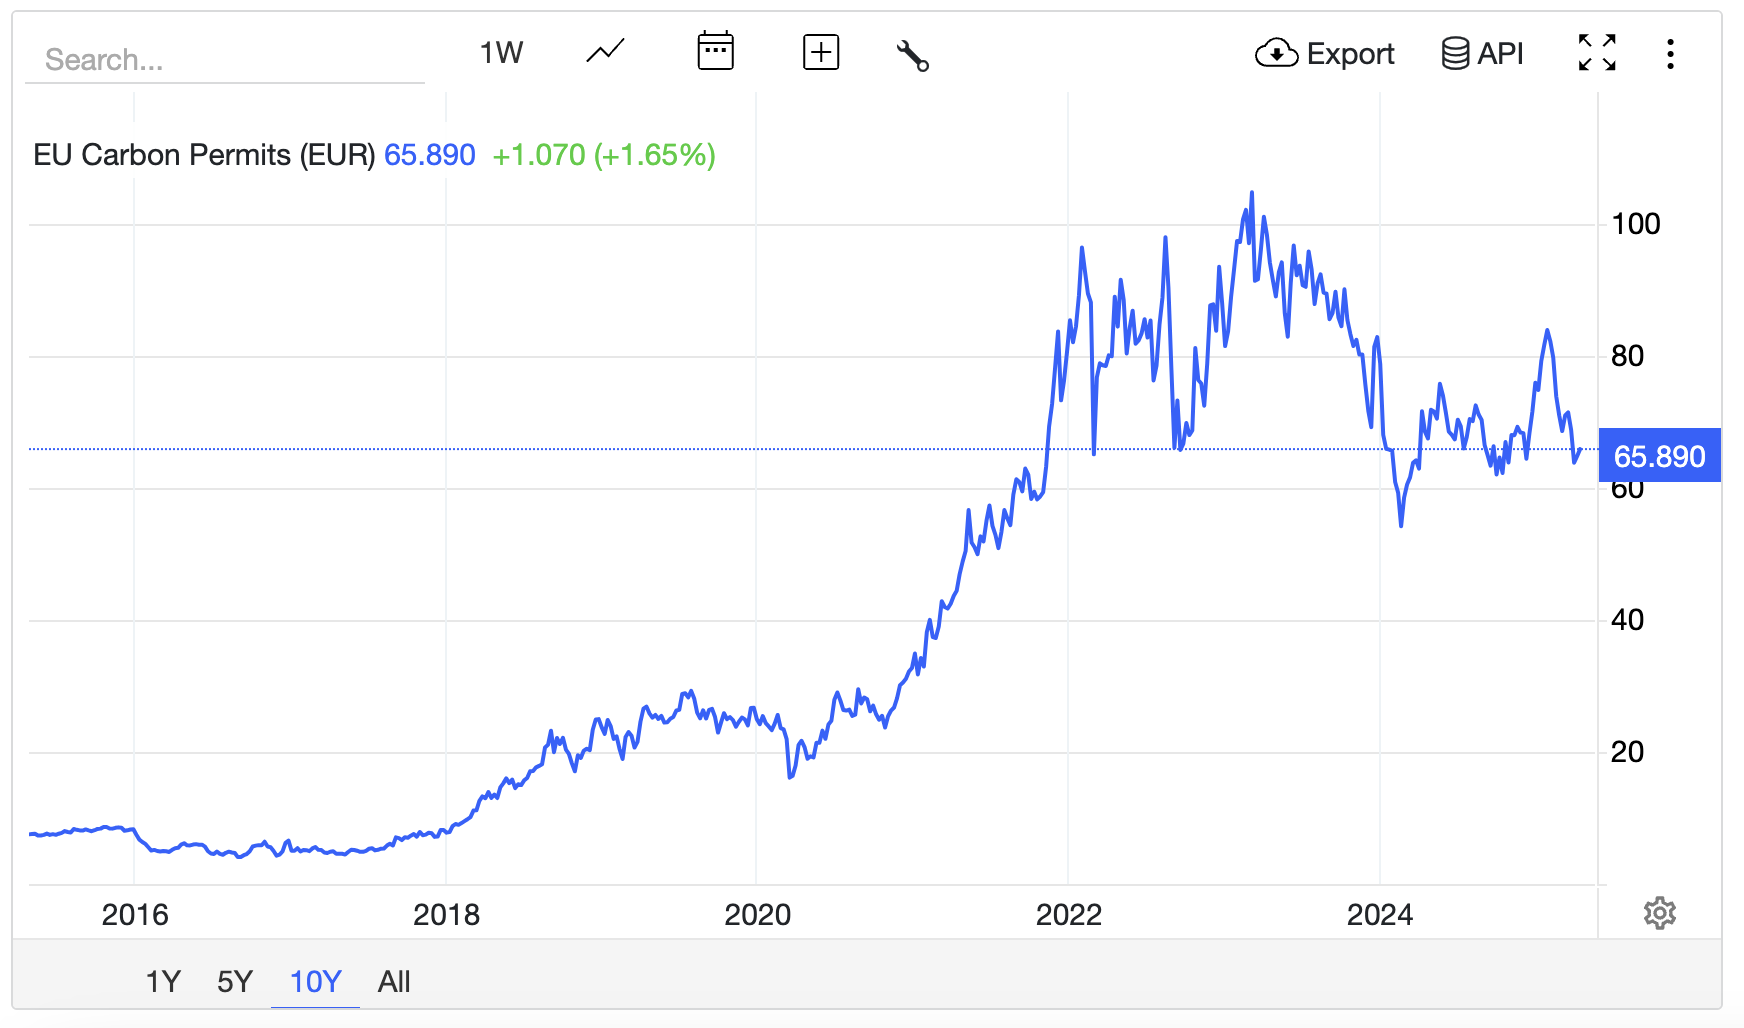
Carbon costs
One of the more positive impacts that has caused prices to rise, is that since 2005, the ETS (EU emissions trading scheme) has imposed a carbon tax on any energy producer relative to their green-house gas emissions. The ETS became the world’s first carbon market, with the aim to price-in environmental impact to energy production.
The impact of the ETS on UK energy pricing can be calculated by:
Carbon cost (£/MWh)=PETS(£/t CO2) × Emission factor (t CO₂/MWh)
PETS = latest allowance price. BEIS (Department for Business, Energy and Industrial Strategy) set the reference price for compensation at £40.06 /tCO₂ for 2024‑25. Therefore, the cost of using Natural Gas to produce electricity, using a CCGT (combined cycle gas turbine) with an efficiency of 50% we get:
Carbon cost (£/MWh)= £40.06/t CO2 × (0.18 t CO2/MWh / 0.5 = 0.36) = £14.4MWh
If we assume a wholesale electricity cost of £80, £14.40 is 18% of the total cost, dropping to only 6% when retail values of £250/MWh are used. In addition, the UK electricity grid has an average carbon intensity of 0.124 t CO₂/MWh (as other sources of energy other than just Natural Gas are used), which pulls that cost down further to £4.96/MWh (6% of the wholesale, and just 2% of the retail price).
Fundamentally, the ETS is designed to impact low-cost, high-emission fuel types, so impacts Natural Gas usage far higher than other sources. Whilst domestic gas usage is outside the scheme, industrial usage of Natural Gas is included:
Carbon cost (£/MWh)= 0.36£/t CO2 × (0.183 t CO2/MWh × (1-0.5) = 0.36)= £7.3/MWh
Although this shows a lower absolute value (because we don’t have the 50% efficiency loss of the CCGT), the relative impact is far higher as wholesale gas prices are ~ £30-35 on the NBP, meaning the tax can be upwards of > 24% of total cost.
This highlights one of the reasons that whilst switching to electric heating is far better in pretty much every way, doing so whilst consuming electricity produced by Natural Gas nets out worse for carbon intensity.
Whilst carbon taxation has increased electricity pricing in the UK, it’s dwarfed by the impact of being a net-importer of energy with dwindling natural resources and next to no domestic storage.
How did we get here?
The North Sea Oil & Gas field was discovered in 1967, bringing with it almost 2 decades of net-exporter revenue, phasing out coal for cheaper, better gas, and reducing costs in-line with supply. Here is some cool data on production levels from 1972. However, by 2000 the production of both gas and oil had peaked, with no new major field discoveries to plug the gap. Very quickly the UK shifted back to being a net-importer by 2004, whilst severely underinvesting in energy storage, grid expansion, and renewable integration.
Although this data is only a forecast from 2021, we can see the expected reduction of production continuing to 2030:
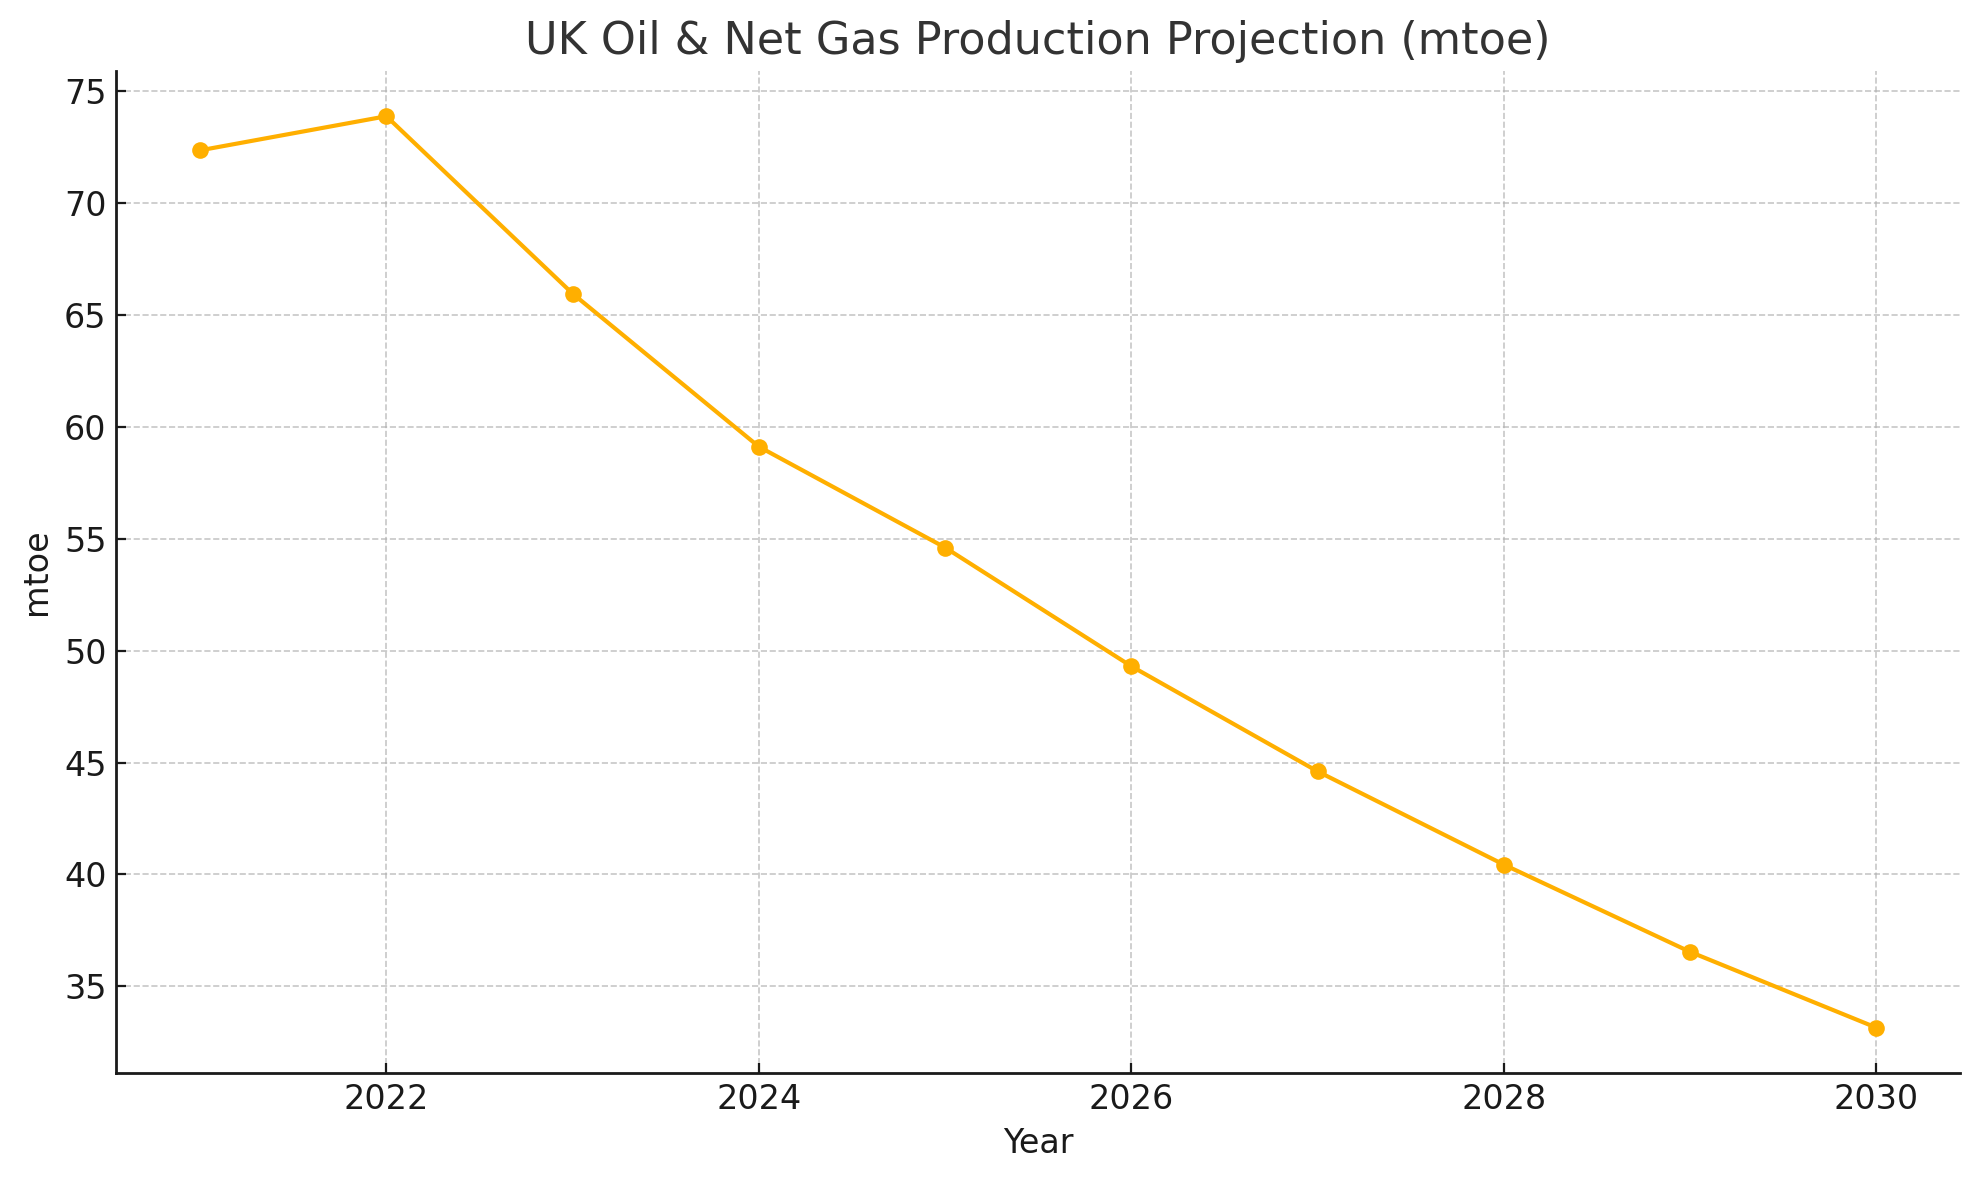
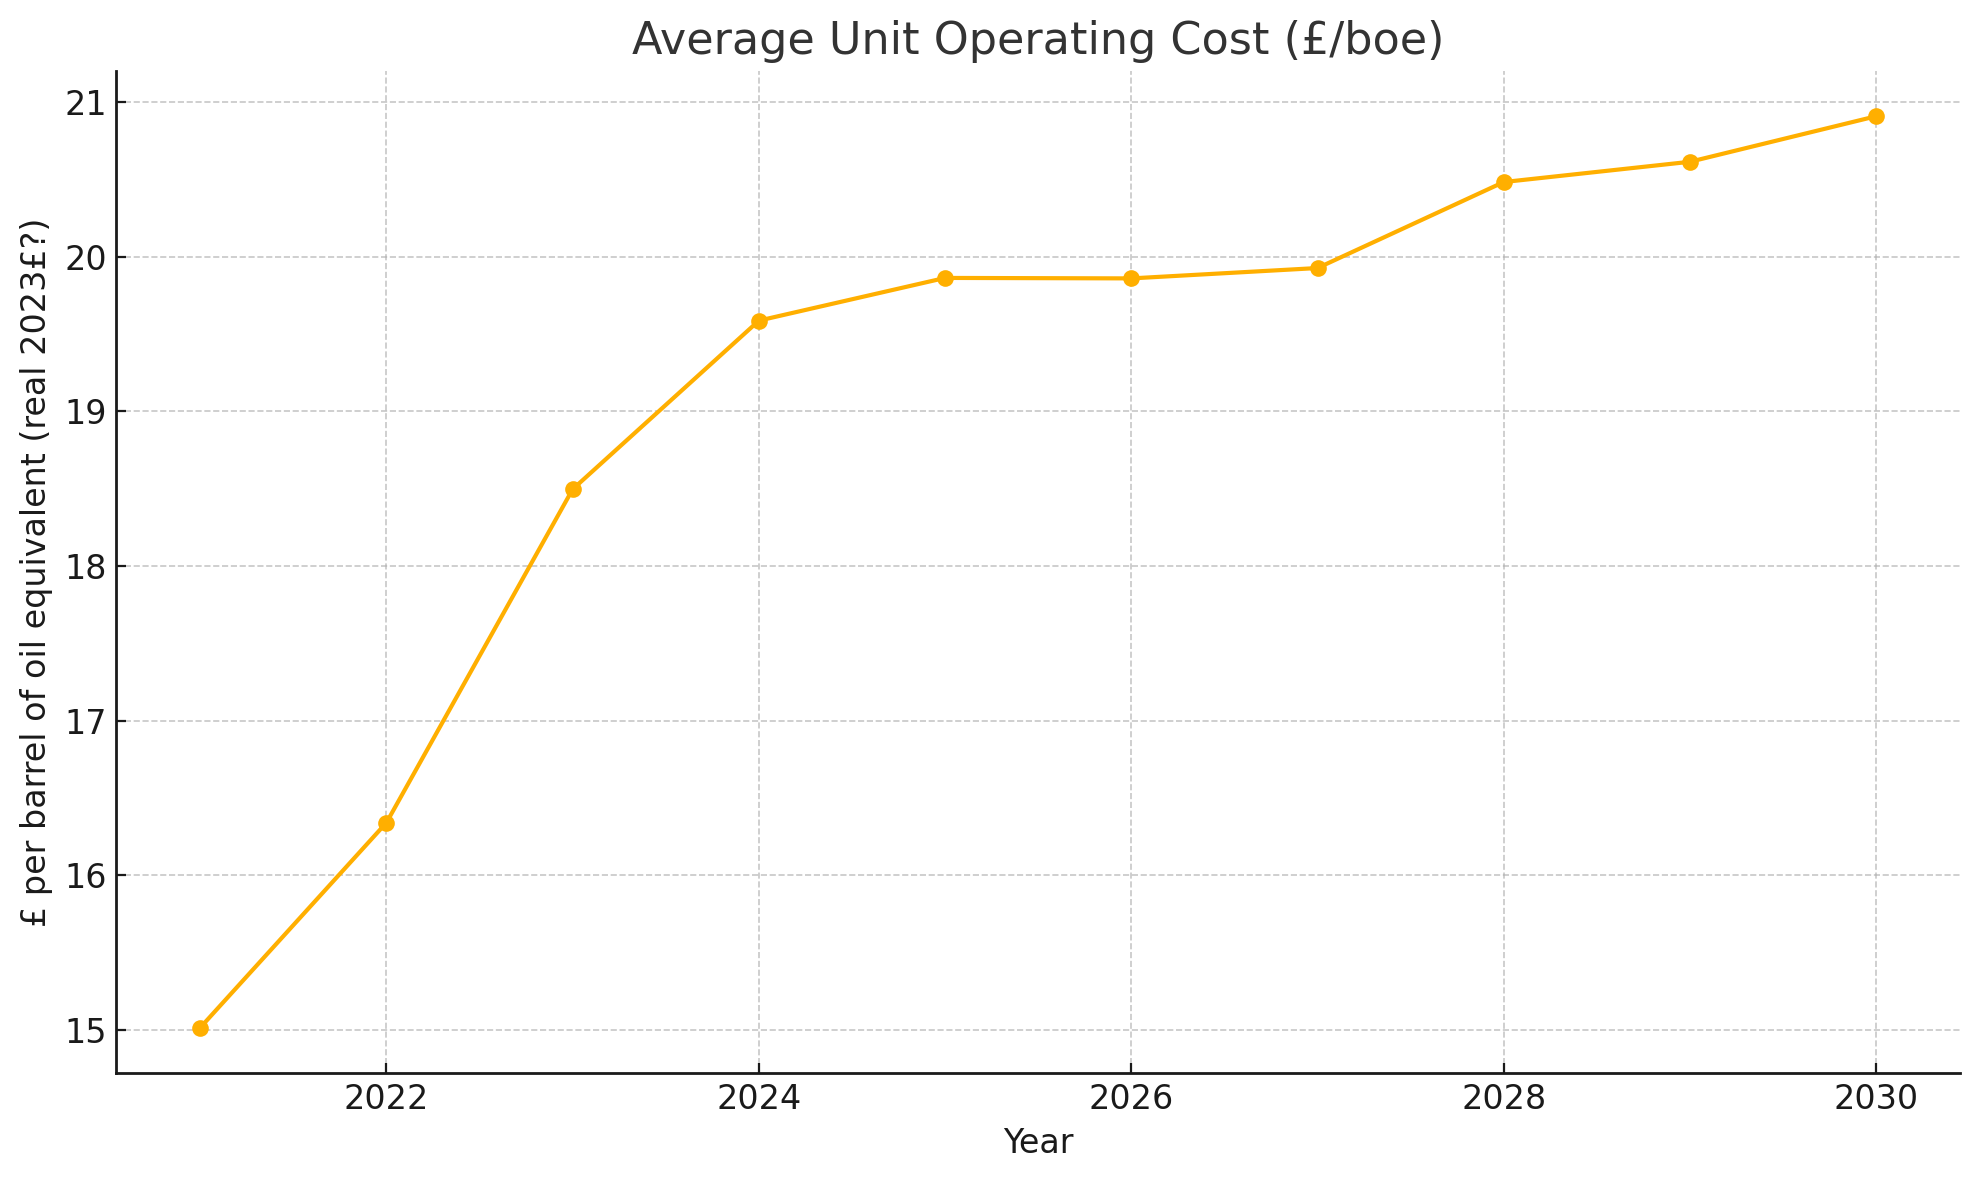
The data also includes production costs, with a steep rise from ~ £15/boe to ~ £21 by 2030, mainly attributed to lower production spreading fixed OPEX over fewer barrels:
Despite large offshore wind build-out, and the learning rate of solar delivering more commercial viability, scale and deployment, Natural Gas still dominated base-load generation, and in-turn put the UK at the mercy of the global spot-price throughout the 2010s as domestic production didn’t plug the gap.
Perhaps disguising the size and scale of this issue was the fact the UK didn’t face any serious energy security issues during that time (2010-2020) and thus didn’t act fast enough to bridge the gap, instead essentially becoming a sitting duck for any future black swan event. This event then came in the form of COVID in 2020, where initially energy prices plummeted to record lows (-£50/MWh) as a result of the global supply chain halting, before skyrocketing to highs of £4,000/MWh on 8 Jan 2021 when the Beast from the East struck. If that wasn’t enough, the double-whammy was delivered by the Ukraine war in 2022, highlighting the UK’s over-reliance on Russian gas imports once the supply was cut off, driving a record wholesale price of £580/MWh/gas in August 2022, with the trickle-down record-high retail price of electricity of £4,279/MWh a few months later.
Impact of high prices
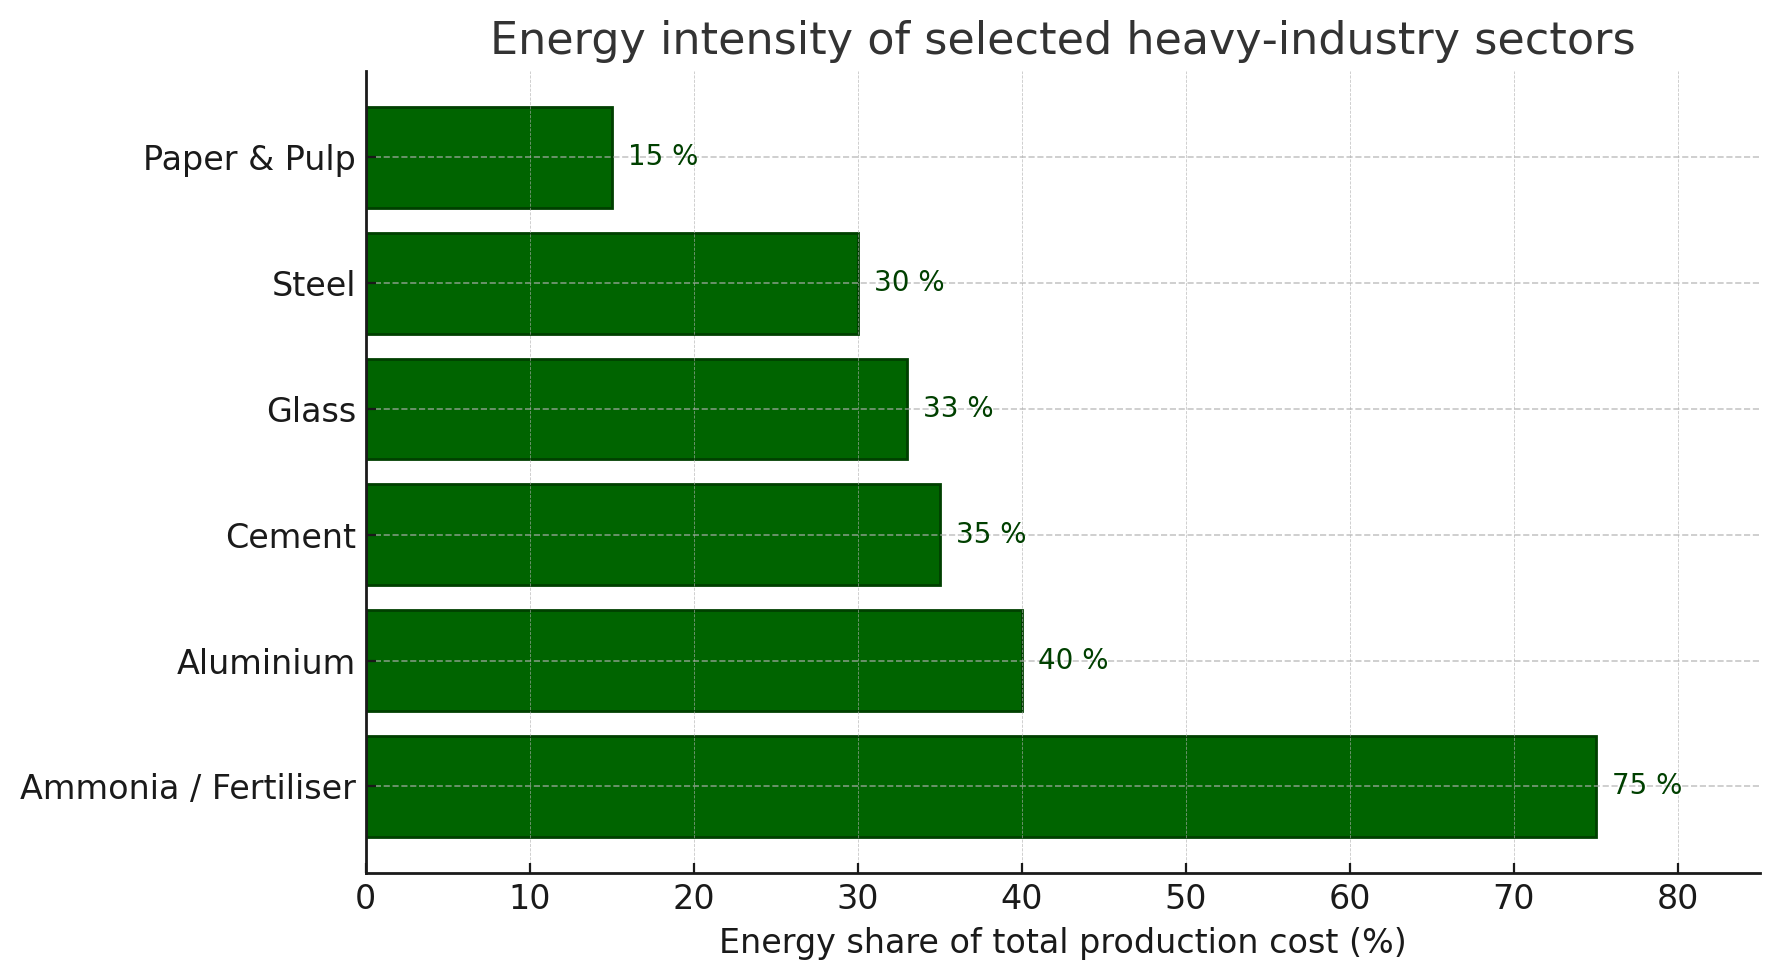
When distilled, these high energy prices act like a regressive tax on society, with wide-ranging negative effects like increased poverty and inequality, industrial ineffectiveness, higher inflation and trade deficits, and political stress. It’s almost impossible for heavy industries such as steel, chemicals and cement, where energy costs make up >30% of total production costs, to operate in the UK when energy costs remain high.
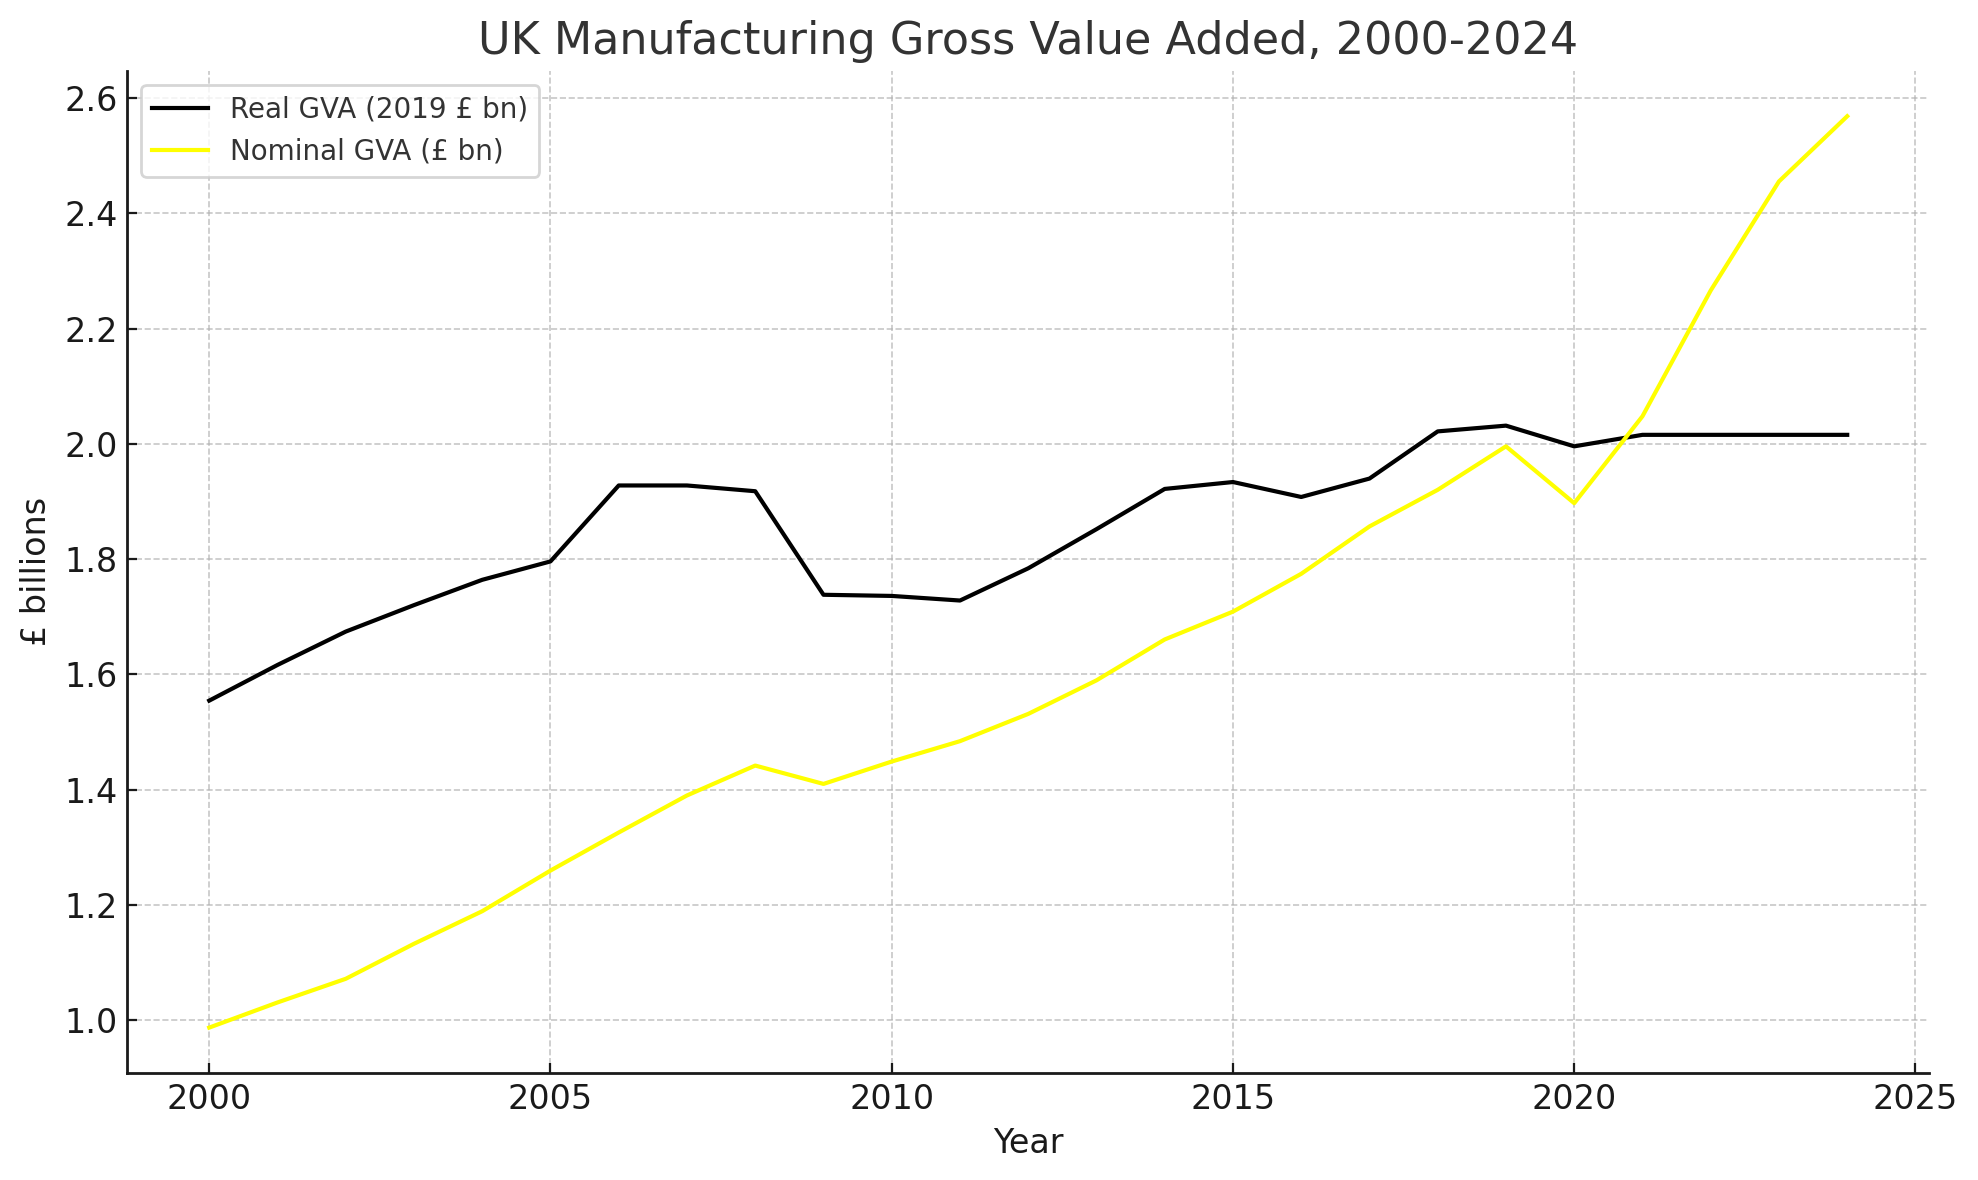
If we look exclusively at Manufacturing production in the UK over the last 25 years, it shows that we have (in absolute terms) increased output. Manufacturing gross value added (GVA) £ bn (black line) being the true manufacturing output after stripping out inflation, Nominal GVA £ bn (yellow line) is the cash value of output including inflation:
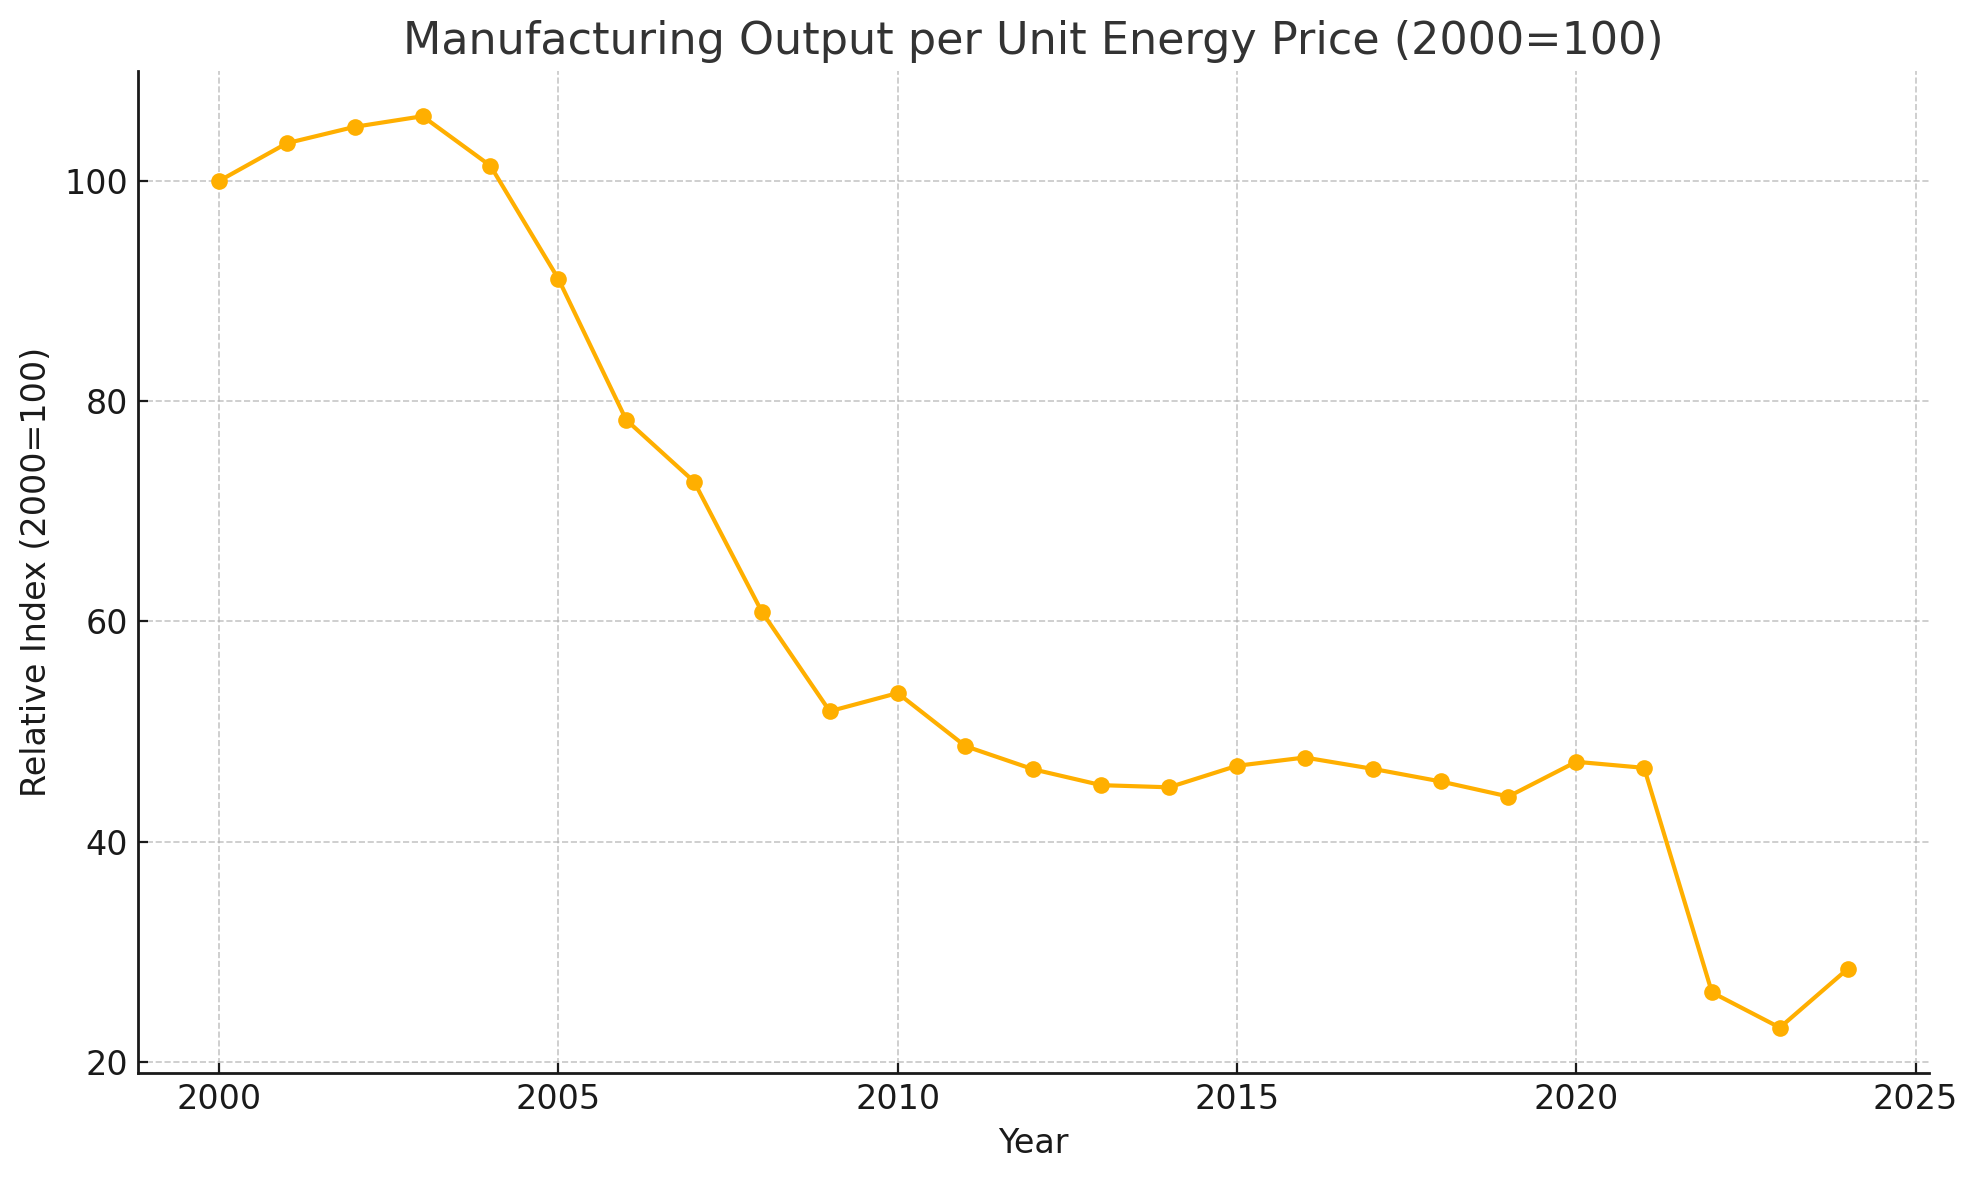
This makes things look ok! However, this doesn’t tell the real story. If we merge the UK’s Manufacturing output, and Electricity, Gas and other fuel pricing together, we can see the true representation, that for the same energy input we now get >75% less output than we did in 2000.
The graph below shows manufacturing output divided by the retail energy‑price index, rebased so 2000 = 100. You can see output per “unit” of energy cost falling by roughly three‑quarters over the period. A unit of energy is calculated by using the ONS price index for household energy in 2015:
Index value t =(average price in 2015 / average price in year t)× 100
| Series | Symbol | Meaning | Base year ( = 100 ) |
|---|---|---|---|
| Manufacturing output | Mt | Real gross value added for all U‑K manufacturing (ONS series L2KX) |
2019 |
| Retail energy prices | Et | CPIH component “Electricity, gas & other fuels” (ONS series L53D) |
2015 |
Manufacturing output is measured by Mt/Et (that is, manufacturing output / retail energy prices). If Mt stays flat but Et doubles, then output halves, as it now takes twice as many energy‑price ‘points’ to buy the same amount of output.
From the 2000 baseline (100), we dropped to 27 by 2021, and then ~24 by 2023. This means each index‑point of retail energy cost now “buys” only one quarter of the manufacturing output it did in 2000, because during that time energy prices have surged and manufacturing output has only moderately increased.
Where do we go from here?
The current zeitgeist surrounding the re-industrialisation of the UK should be reviewed with the lens of why it left our shores in the first-place. Unless we find ways to dramatically increase domestic energy production and increase national storage, it’s highly unlikely (or impossible without subsidies) for any sort of significant industrial process to be economical in the UK. Alongside this, the UK’s over exposure to spot market pricing is likely to be exacerbated as we likely enter a demand-boom in the form of AI data centres.
To give an idea of how difficult it is to compete and increase productivity when energy costs are high, you don’t need to look any further than the input energy cost as a % of total production cost. There is only one Aluminium Smelter left in the UK (Lochaber smelter, Fort William), and no Ammonia production after both CF Fertilisers UK sites closed in 2022 (Teeside) and 2023 (Cheshire), respectively.
Despite this, there are a number of things we can do to stem the bleed and drive towards a more sustainable and affordable energy market in the UK:
Battery Storage
Current discourse often focuses on building more transmission, that is the cables, transformers and sub-stations that help distribute electrons across vast distances at high-voltages. Greater transmission allows greater ability to shift location of an electron from A to B, from where supply is high to where demand is high. Building transmission is expensive and lengthy, as it requires significant civil work alongside public barriers in planning. A single 50km stretch of cables could intersect hundreds of parcels of land, houses, and planning restrictions that either slow things down or block altogether. This shows in our ability to build more transmission, dropping to almost nothing from 1990 – 2015:

However, building more transmission misunderstands the problem. Increased transmission helps distribute energy in space. We need to distribute energy in time (storage). The UK produces ~ 300TWh/yr of electricity today, with ~ 270 TWh of demand, split 94.4 TWh; industrial was 82.2 TWh; commercial 62.4 TWh. In the first half of 2025, >5.5TWh was curtailed as a result of the grid being overloaded. We can choose to build transmission to help ease that, or we can follow the learning rate of batteries to shift production a few hours to when is needed:

A great paper from 2017 titled “Geophysical constraints on the reliability of solar and wind power in the United States” from Shaner, Davis, Lewis, and Caldiera makes the case evaluating 39 years of demand and production data to clearly show the different options for satisfying national energy demand with renewables, with large-scale build out of batteries and overbuild of solar destroying the other options. In other words, if you overbuild production (solar) and batteries, you can satisfy 99% of energy demand in the US without additional transmission build:
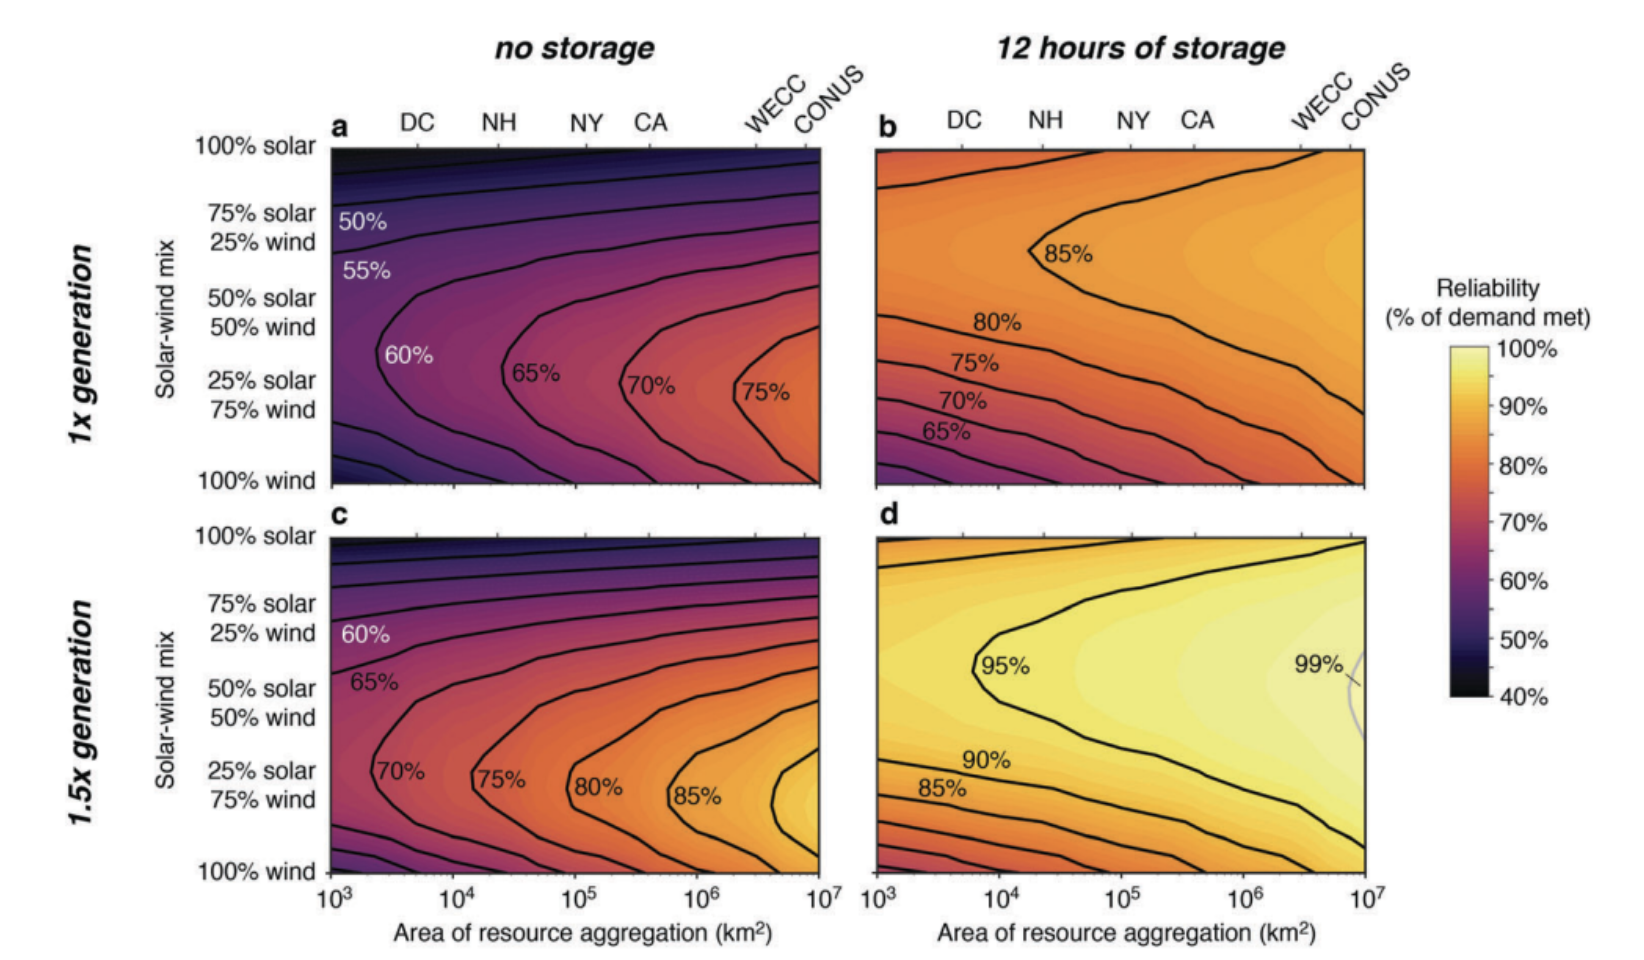
The bottom-right quadrant shows the impact of overbuilding solar and wind, combined with large-scale battery storage, catering for 99% of US demand.
The UK is currently aiming for 23-27 GWs of short-duration battery storage (2 hours), and 4-6 GWs of long duration (4+ hours) by 2030. If we sit at ~ 5GWs today, assuming we add another 20GWs, we will clear 50GWh of 2+ hour storage by 2030. With lithium-ion batteries now <£100/kWh for the first-time, that’s £2b in capex, double for BoP and peripheral infrastructure and you hit £4b. The downstream impact is that you’ll likely half curtailment (not including Scottish wind farms), reduce gas reliance (thus reducing gas setting the price), and save the ESO some of the £2b/yr spent on balancing the grid. Based on these numbers, it feels like this could be more aggressive.
Physical storage
The UK is going to have a significant amount of gaseous and liquid-phase fuels for a long while – especially if we intend on making anything again. Therefore, we must reduce exposure to the spot-market with better planning and storage inventory (some planned examples here and here). Perhaps, even use the pipelines themselves?
It’s difficult to calculate the immediate cost benefits of this, but we can assume during times of low-storage a market premium was paid to stay afloat. The UK imported ~ 214TWh of gas in 2023, assuming standard pricing of £40/MWh paid. This sums to £8.5b if no premium was paid. We can assume somewhere between 5-15% premium (£2-£6/MWh), equating to between £500m – £1.3b in premiums paid over and above usual gas pricing based on low storage volume. Considering we’re investing £2b into Rough, this feels like quick payback.
Transmission
Our focus should be on storage, but this doesn’t mean we shouldn’t build transmission at all. We have large areas of production where consumption is very low (For example wind energy in Scotland) that is hamstrung because of over-congested distribution lines. Here’s a good map of generation across the UK. Roughly 70% of the 400GWs in the UK queue won’t benefit from additional battery storage, and fundamentally requires new 400kV lines and substations to get operational. Key transmission lines from Scotland southward, Wales to England, The Southwest towards the East, and London downwards are all looking a little light.

The challenge the UK has is that it’s not particularly sunny (1100 kWh/kWp in areas, miles away from the 1800 kWh/kWp you see in southern Spain) and land-locked with limited natural resources. Increased GDP is inherently linked to energy consumption, so other than the above we need to play to our strengths and build production from what we do have.
Wind
The UK has over a third of Europe’s entire wind resource. In theory, if you take the ~ 10% of the available 800,000 km^2 of land as suitable for wind farms, we have ~ 80,000km^2 to capture the wind. Max packing density is on the order of 5MW/km^2 for turbines, equating to roughly 400GW of capacity. Wind has a great capacity factor of ~50%, meaning we could in theory produce up to 1750 TWh of wind energy per year. That’s almost 6x the UK’s demand, and ~ 50% of the entirety of US demand. We need to find more ways to build wind, cheaply and quickly. Let’s start making turbines!
Domestic production of fuels
Despite increasing renewable expansion, many industries in the UK require gaseous or liquid fuels to operate effectively. Industrial processes like steel, cement, chemicals and long-haul aviation require either energy density that batteries can’t offer, or molecule feedstocks. Much of this demand is today serviced by high-cost fossil imports, but now has the opportunity to shift to a scalable long-term decarbonised solution. Beyond-the-grid solar (and some wind) is now significantly cheaper per kWh than fossil gas or diesel, meaning for industries like the above where a molecule is required over an electron, solar energy can be used to as a feedstock to produce synthetic gas or liquid-phase fuels – cheaply:
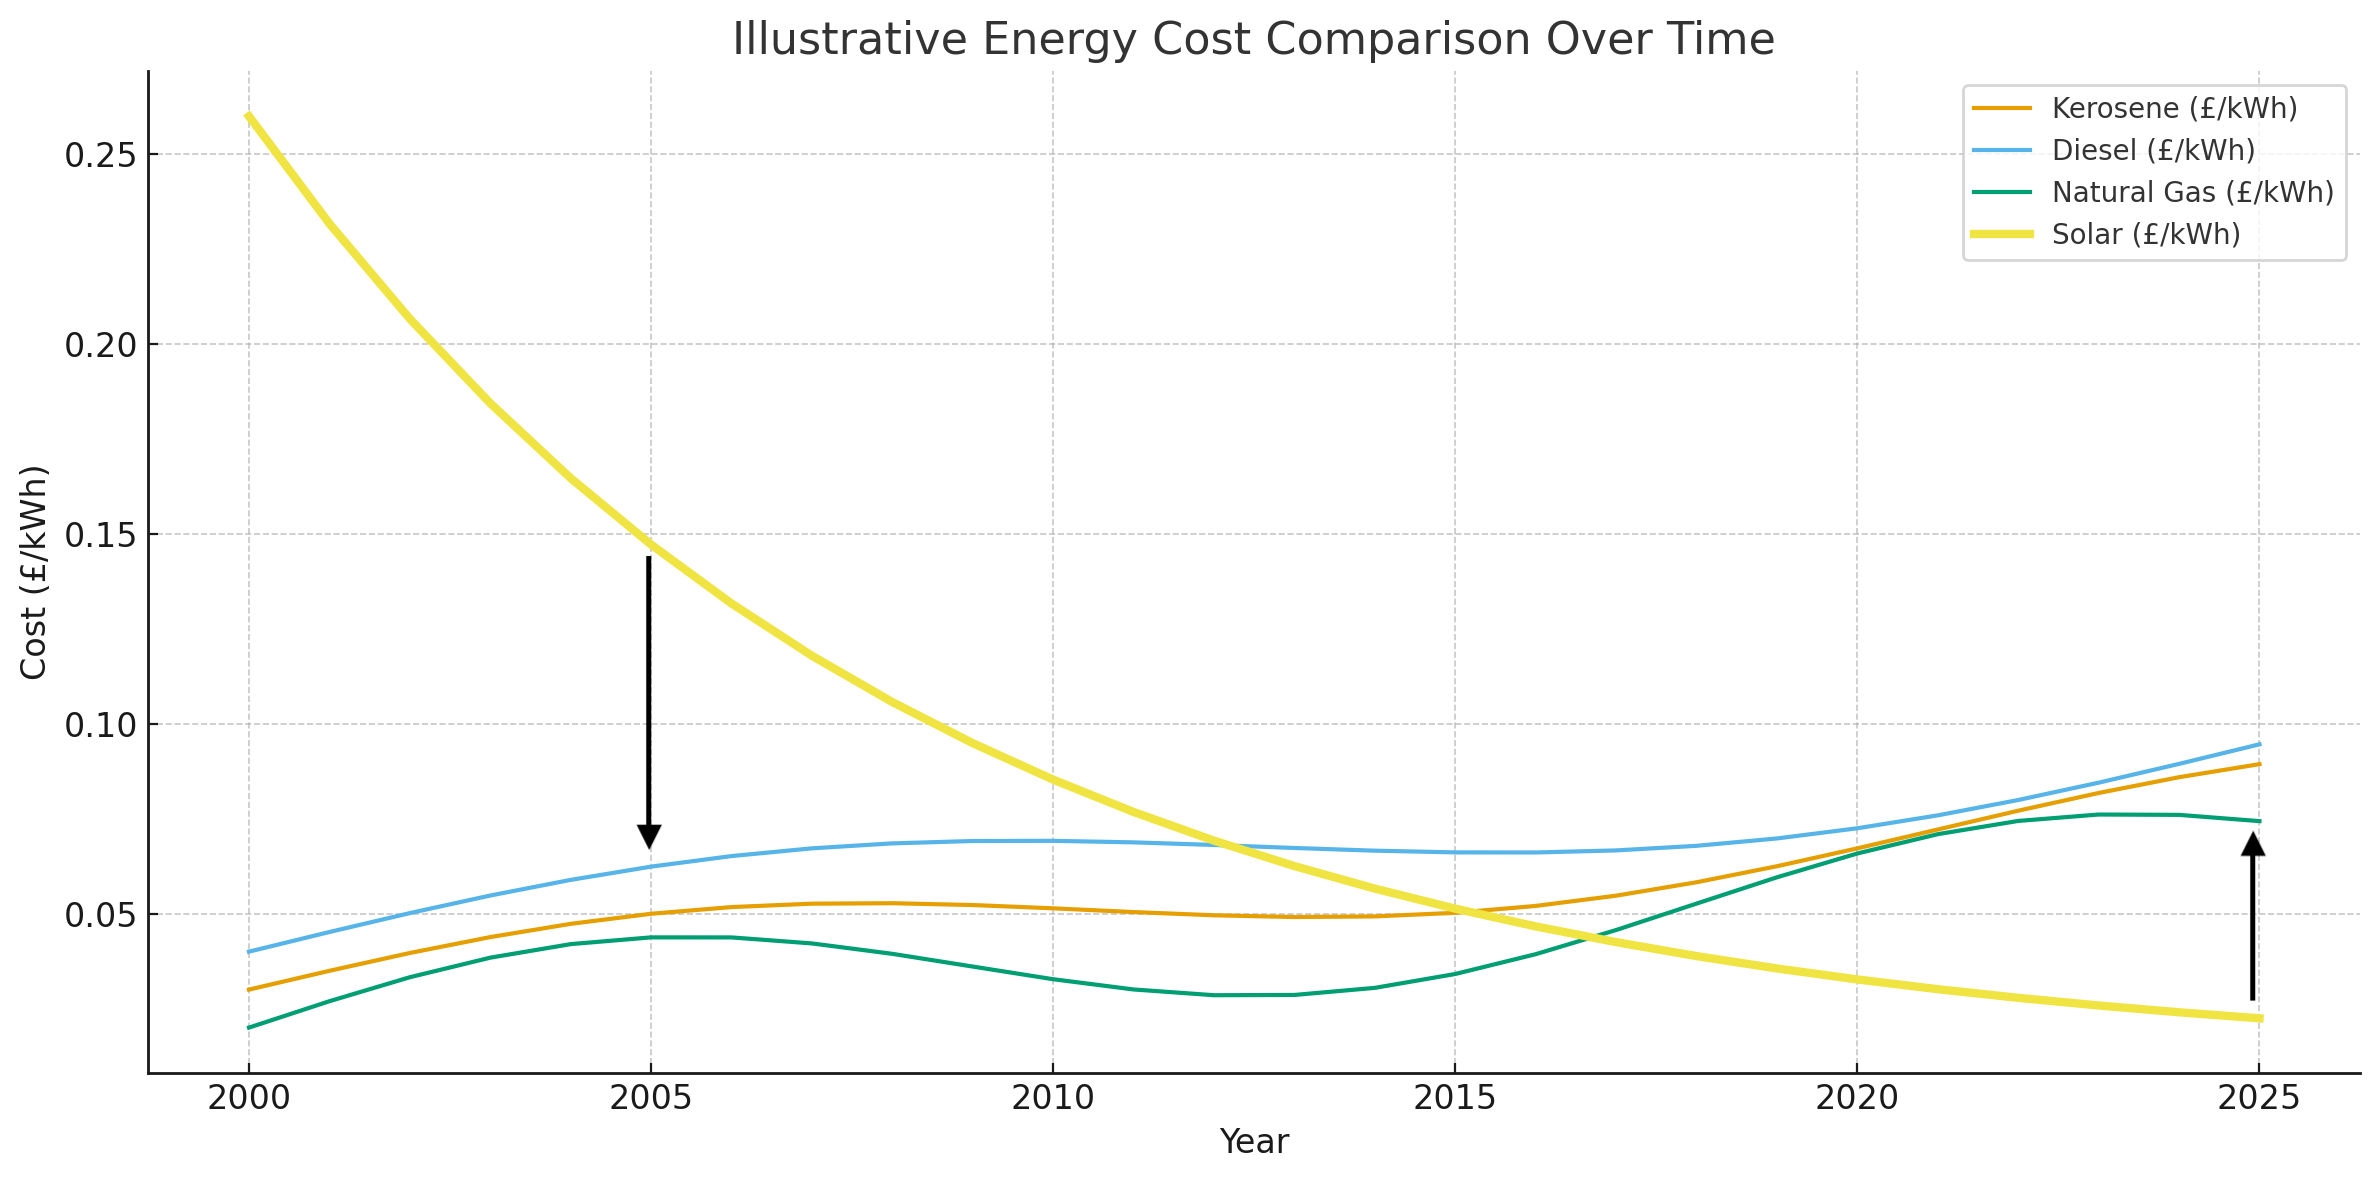
For the first time in history, well known processes like Haber-Bosch to produce Ammonia (amongst other things), methanation to produce Methane, and Fischer-Trospch to produce kerosene can be financially viable with entirely carbon-neutral H2 and CO2. This is the challenge Rivan has taken on, vertically integrating the engineering, manufacture and deployment of synthetic fuel plants to decarbonise heavy industry and provide energy security to the UK and Europe.

Bringing it together
It’s clear that when production peaked in the North Sea in the early 2000s, we weren’t remotely ready. This set about a chain reaction that helped destroy manufacturing in the UK and increased reliance on energy imports. Infrastructure and storage build-out hasn’t kept up with demand, meaning a large part of our energy base is still anchored on imported fossil gas, increasing pricing for everyone. Things are gradually changing, shocked into action from COVID and the Ukraine war, but we’re still dealing with the debt of 1-2 decades of under resourcing. We stand a chance of competing if the rapid build-out of batteries and the expansion of domestic production (solar, wind, and synthetic fuels) continue to accelerate, but we’ll have to overcome a regression to the mean to make it happen.